AxeDB: Guitar Pricing Intelligence
New project for studying the used and vintage guitar markets
July 28, 2019
For the past several months I’ve been collecting bid prices from the adtech auctions taking place in my browser. What follows are some findings from this data and what they tell us about monetization strategy in digital media.
If you want to collect your own data, I’ve open sourced the chrome extension I used to collect data for this post. Check it out here!
The primary method through which websites make money is selling ads (we’ll ignore subscriptions, sponsored content, etc. in this post.) In the early days of the Internet ads were sold directly to advertisers. This proved to be profitable, but left both sides of the transaction dissatisfied; the publisher couldn’t sell enough ads to monetize all of their pageviews, and the advertiser had trouble reaching scale, with the limiting factor being that both sides needed to negotiate pricing and logistics before the ad campaign could run. Monetizing a site’s traffic was too slow and required too much human input to work at Internet scale.
The answer to this problem was programmatic ads. Programmatic ads allow a site to auction off its remaining ad inventory on an open market. Advertisers, similarly, can reach essentially the entire world population through these open markets if they’re willing to pay. The primary way most sites sell programmatic ads is through an ad exchange that’s built into their ad server (AdX, and OpenX are two prominent examples.) The exchange, then, sends bid requests to thousands of demand-side platforms who are able to place bids to buy individual ad impressions on behalf of the brands they represent.
Using only one ad exchange, though, leaves a publisher’s business overly dependent on a single outside party, and also leaves them limited to the advertisers working with that particular exchange. The practice of header bidding has taken off in recent years as a response to this. Header bidding allows a publisher to make ad inventory available to several ad exchanges in parallel to the exchange that’s native to their ad server. The winning bids from all the exchanges are then able to compete with each other, with the most valuable bid winning the ad impression. This increased competition means that the publisher is able to get higher prices for their ad inventory. For a more thorough explainer, Digiday explains the practice better than I will.
There’s very little publicly-available data in the adtech space. And for good reason! For anyone whose business is to participate in advertising auctions, data (and what they do with it) is their secret sauce. Similarly, my employer wouldn’t have been too keen on me writing a post using company data. So I made my own dataset.
While most of the advertising world is hidden, we can get a glimpse into one special class of auction: client-side header bidding. Here the bids are placed within a user’s browser, making them accessible if you’re able to identify and understand the requests coming from an auction. I built a chrome extension called Auction House that parses a browser’s requests and collects data from ad auctions, making it easy to run your own adtech data collection.
I collected the following data on each bid using this tool:
In total I collected 96,306 bids from 30,600 auctions from January 1 to July 20, 2019. What follows are my primary findings for what this data can teach us about pricing in online advertising auctions.
The first point of interest is seasonality. At the population level there are several levels of seasonality in the programmatic advertising market. Demand moves according to time of day, day of week, and day of month, as well as quarterly and annual seasonality. Time of day and day of week seasonality are mostly due to consumer behavior; you’re more likely to buy something on nights and weekends, and therefore your attention is worth more to advertisers.
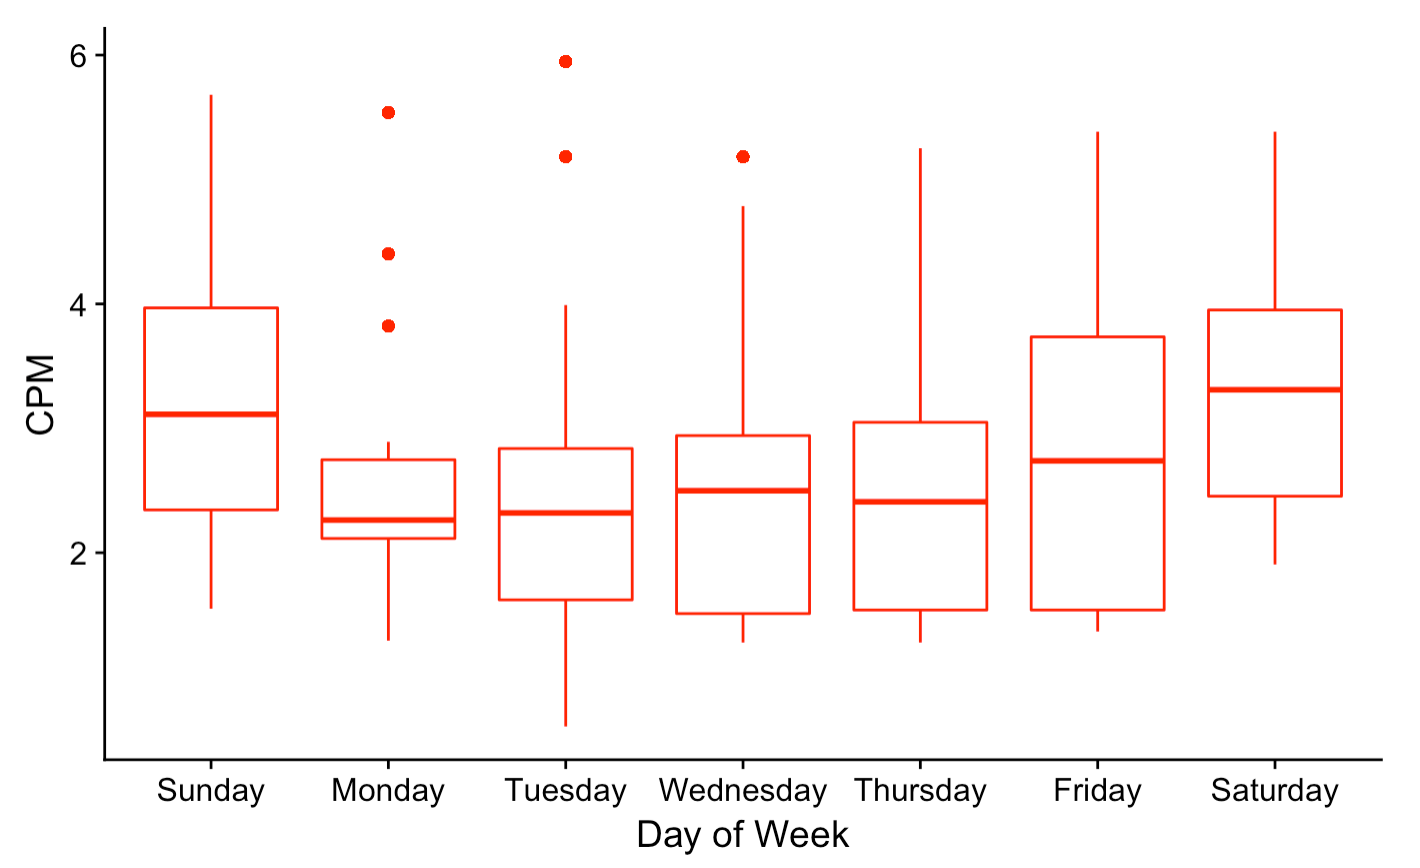
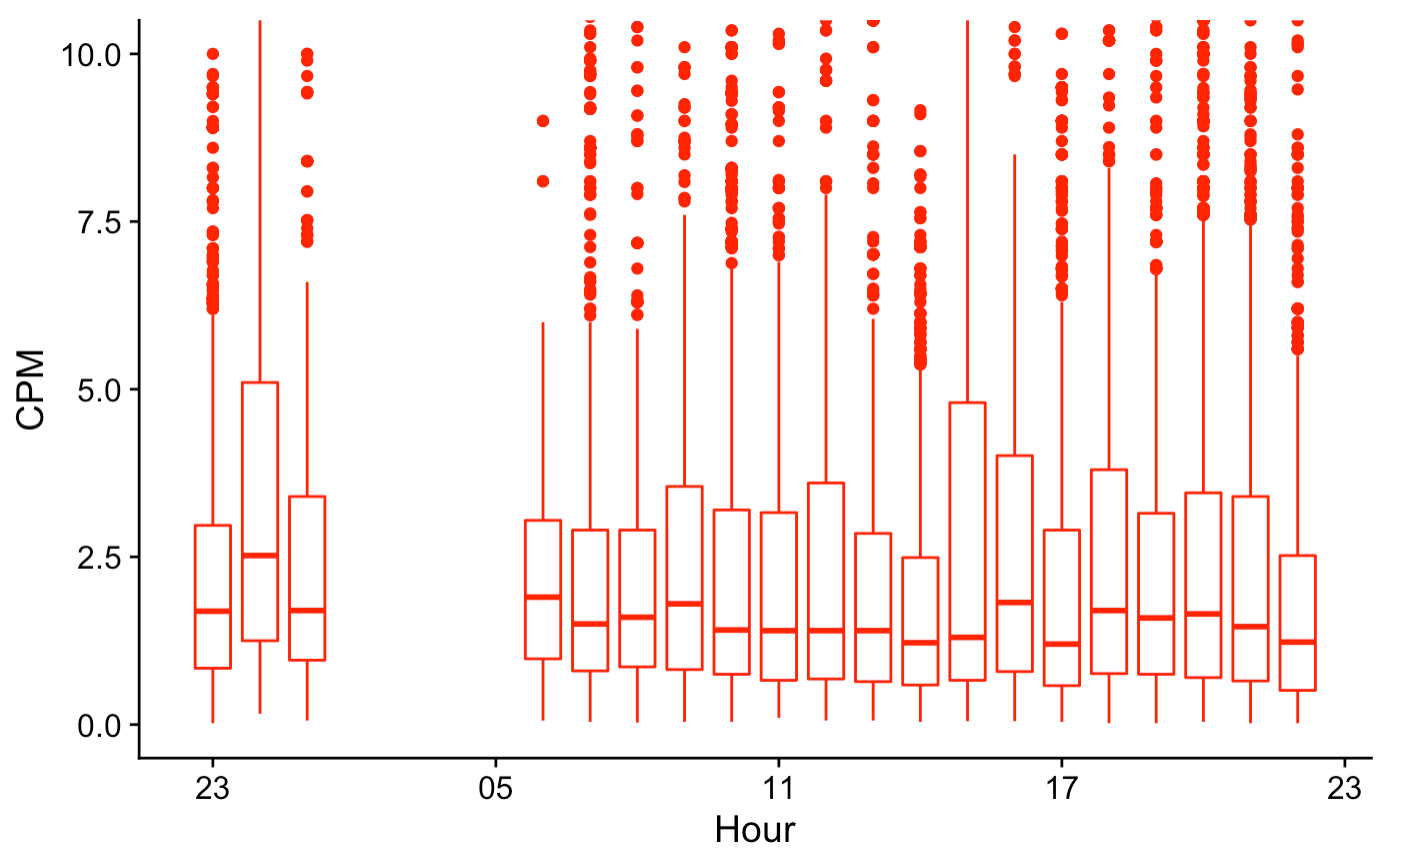
These trends are supported in this dataset. Using boxplots to show both mean and interquartile range of CPM (cost per 1000 impressions), Friday through Sunday ad prices are significantly higher than Monday through Thursday prices. The lower quartile price for Saturday and Sunday is roughly the mean price on weekdays, which is a pretty large gap. The time-of-day pattern is less pronounced, but prices are slightly higher at night.
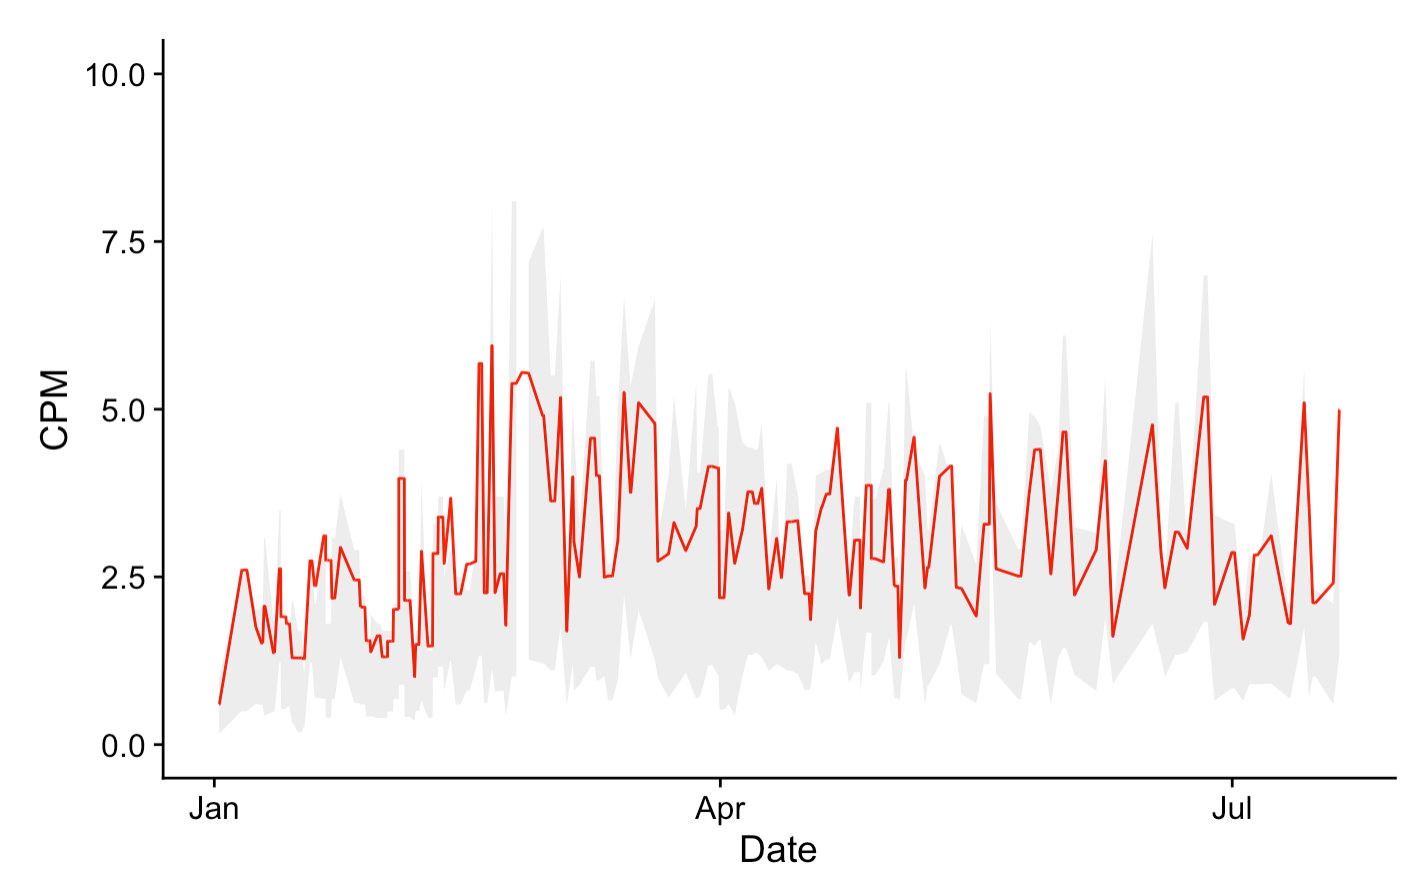
There are also more global seasonal trends. The demand for online ad impressions is far from uniform throughout the year. A given company’s ads generally don’t make their way onto the Internet until the company has struck a deal with a demand side platform (DSP) who will handle the technical overhead of participating in ad auctions on their behalf. The DSP will set a series of goals for the company’s ads, including how many ads they plan to deliver, the expected cost, and the timeframe in which it will execute its ad buys. As a result of this fairly-traditional purchasing process, the demand for ads mostly follows the same business cycle as traditional business. This means that campaigns are typically set up to run on a monthly, quarterly, and annual basis. Demand rises through each of these cycles, partially re-setting at the end of each cycle until it reaches its peak during the Christmas holiday.
These trends weren’t as pronounced as I’d hoped they would be in this data, but it’s still visible. January has a low CPM, and you can see a slight decrease at the ends of March and June (when Q1 and Q2 budgets are expiring.) You can also see the more frequent, local spikes in demand coming from weekly seasonality. It will be interesting to look back on this next January if I keep recording this data, as the CPM gain is more dramatic in Q4.
In the below plot, the red line is each day’s average CPM, with the gray region being the interquartile range. The mean CPM is always in the upper end of the interquartile range, as there are many high prices skewing the data in the positive direction (while the other end of the distribution is bounded by a minimum value of zero.)
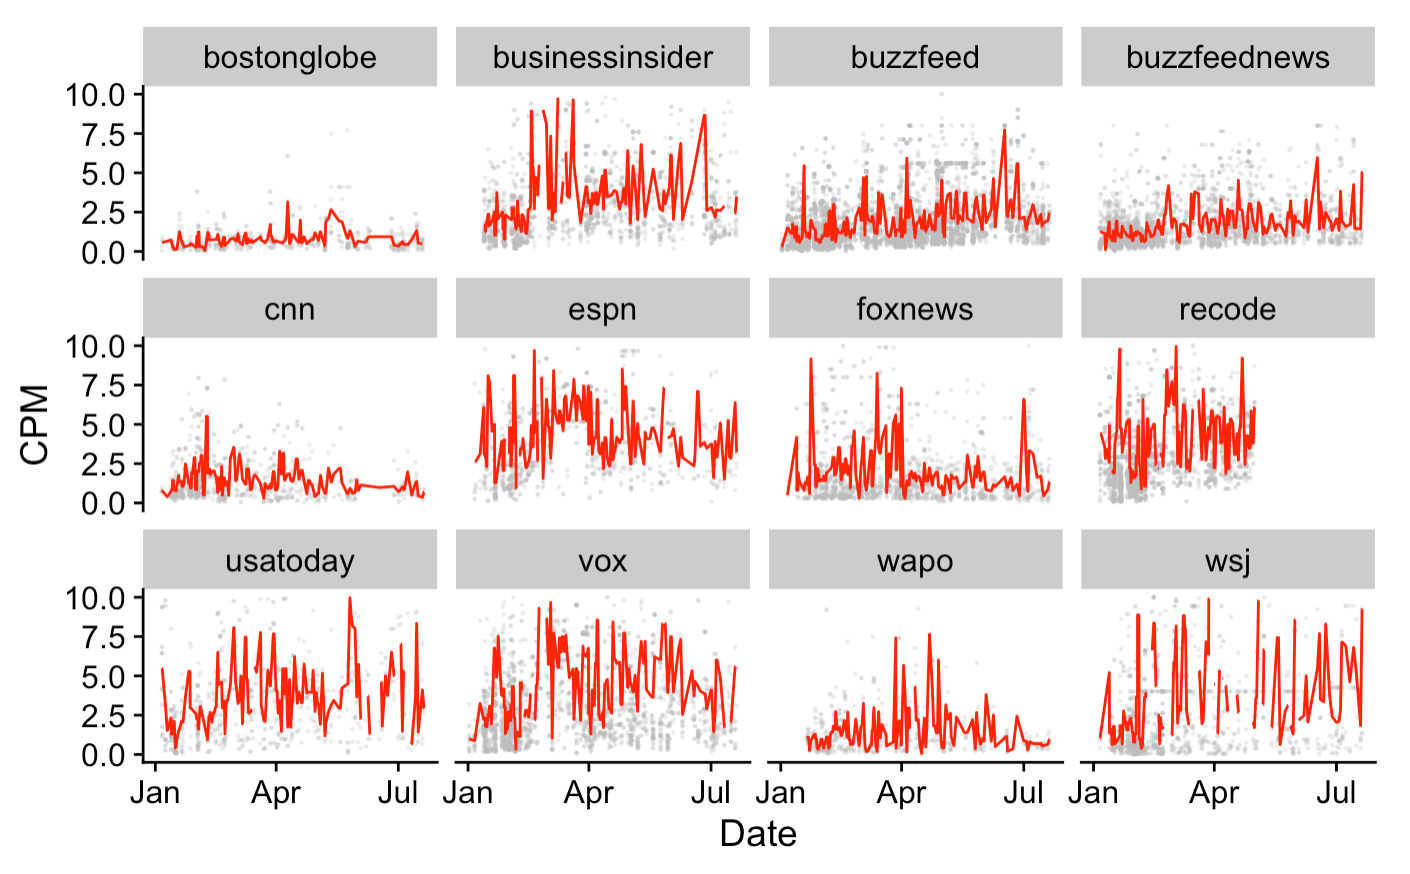
Last, you can see that the seasonal trend isn’t the same for all sites. BuzzFeed and BuzzFeed News have steady growth, while Vox and USA Today are noisy. ESPN implements a high price floor throughout March causing artificially high CPM. CNN disappears completely for a few weeks in June when they apparently temporarily stopped using Prebid. Recode disappears when their parent company dissolved their site in April. This variety is fitting, as there are many adtech strategies a publisher can pursue, and the collection of sites I examine in this data employ them all to varying extents. Each figure in the below grid could be a case study in itself.
The sell-side partners (SSPs) a publisher chooses to work with are a key component in their monetization strategy. Working with more exchanges generally means more demand has access to a site’s ad inventory, which means there’s a higher chance that it sells for a high price. Client-side header bidding also adds latency to a website, however, so at a certain point adding additional SSPs begins to degrade site performance, leading to a worse user experience and traffic decline.
Here are the most common SSPs I’ve seen from observing bidding patterns over the past 7 months, ordered by the number of impressions they’ve won.
| Bidder | CPM (mean) | CPM (stddev) | Impressions |
|---|---|---|---|
| Rubicon | 3.04 | 4.09 | 8849 |
| AppNexus | 2.03 | 2.92 | 6534 |
| Index | 2.39 | 2.74 | 5622 |
| OpenX | 1.78 | 2.14 | 2367 |
| TrustX | 4.94 | 5.29 | 2090 |
| AOL | 2.01 | 2.80 | 1523 |
| Consumable | 3.55 | 4.10 | 1083 |
| AppNexus | 1.13 | 1.79 | 581 |
| TripleLift | 3.88 | 2.94 | 538 |
| PubMatic | 2.48 | 1.54 | 385 |
These are all big names in the industry, each having collected a massive network of DSPs providing publishers access to the majority of the internet’s display advertising demand. There is also a long tail of less-known SSPs in this data. Among these are Colossus and Aardvark, which are apparently SSPs but I couldn’t even find their company websites.
From the sites I examined, the sweet spot for how many exchanges to include in one’s header seems to be around four. This doesn’t mean it’s optimal, but it does appear to be an industry standard among major publishers.
Related to the number of SSPs a publisher works with is how many are placing bids for a given ad impression. Breaking it out this way, you can see the expected result: more auction participants leads to a higher clearing price. This fits with what existing economic theory teaches us: holding supply constant, an increase in demand (here by way of expanding the number of bidders with access to a site’s inventory) will lead to higher prices. The pattern is imperfect (four bids has a lower cpm then three in this data), but this is probably because it’s looking at data across several sites.
| Bids Submitted | CPM | Count |
|---|---|---|
| 1 | 1.64 | 4264 |
| 2 | 2.22 | 5980 |
| 3 | 3.35 | 7775 |
| 4 | 2.68 | 8717 |
| 5 | 3.42 | 2329 |
| 6 | 5.35 | 1092 |
It’s worth noting that this relationship isn’t perfectly causal in this data. The reason why SSPs are submitting bids is an unobserved confounding factor. Maybe the user has unpurchased items in their Amazon shopping cart, for example, which is causing both higher bid prices from advertisers and a higher number of bids to be placed. It’s not possible to remove all these unknowable confounding factors, but the pattern is clear enough where you can feel confident in saying that increasing the amount of demand with access to a given piece of ad inventory leads to higher prices.
Another important driver of ad value is the size of the ad. Similar to with traditional advertising, larger ads have a higher market rate.
| Creative Size | CPM (mean) | CPM (stddev) | Impressions |
|---|---|---|---|
| 728x90 | 2.27 | 3.07 | 11012 |
| 300x250 | 2.78 | 3.48 | 10011 |
| 300x600 | 2.68 | 3.42 | 5052 |
| 970x250 | 3.57 | 4.81 | 2585 |
| 1030x590 | 16.41 | 2.76 | 261 |
| 970x90 | 1.34 | 1.37 | 172 |
| 640x480 | 14.27 | 8.54 | 58 |
| 160x600 | 1.17 | 1.52 | 48 |
It’s a bit deceptive to look at this in cross-site data, since every site’s implementation of these ads will be slightly different and drive different values. You can see, however, that a 970x250 ad is worth significantly more than a 728x90, which will often be eligible to serve in the same top-of-page ad slot. Similarly, a 300x600 ad has a higher cpm on average than a 160x600, which it generally competes with for space in a site’s sidebar.
Other comparisons from this table are less fair. A 728x90, for example, typically serves in a completely different section of a page than a 300x250, meaning that their performance metrics are vastly different. This causes their CPMs to differ for reasons entirely unrelated to the size itself. Other sizes, such as Vox’s 1030x590 ads, are not industry standard and serve in a completely different way than traditional ads, making it unfair to compare against more standard sizes.
In general, all else equal, bigger is better in terms of an ad’s value.
Another theme I found in this data is the impact that ad density has on pricing. Economics 101 says that if you flood a market with supply without a corresponding decrease in demand, the per-unit price goes down. This is exactly what happens when a website adds additional ads.
It’s not obvious how to define “the market” in this context, but if you think of it as the market for ad impressions on a given site, or for a given subset of users, then it follows that a site increasing the number of ads per pageview can negatively impact the CPM it receives. This is probably a fair way of looking at things, as ad campaigns are often limited to small pools of users and websites, making market definitions very small and specific in scope.
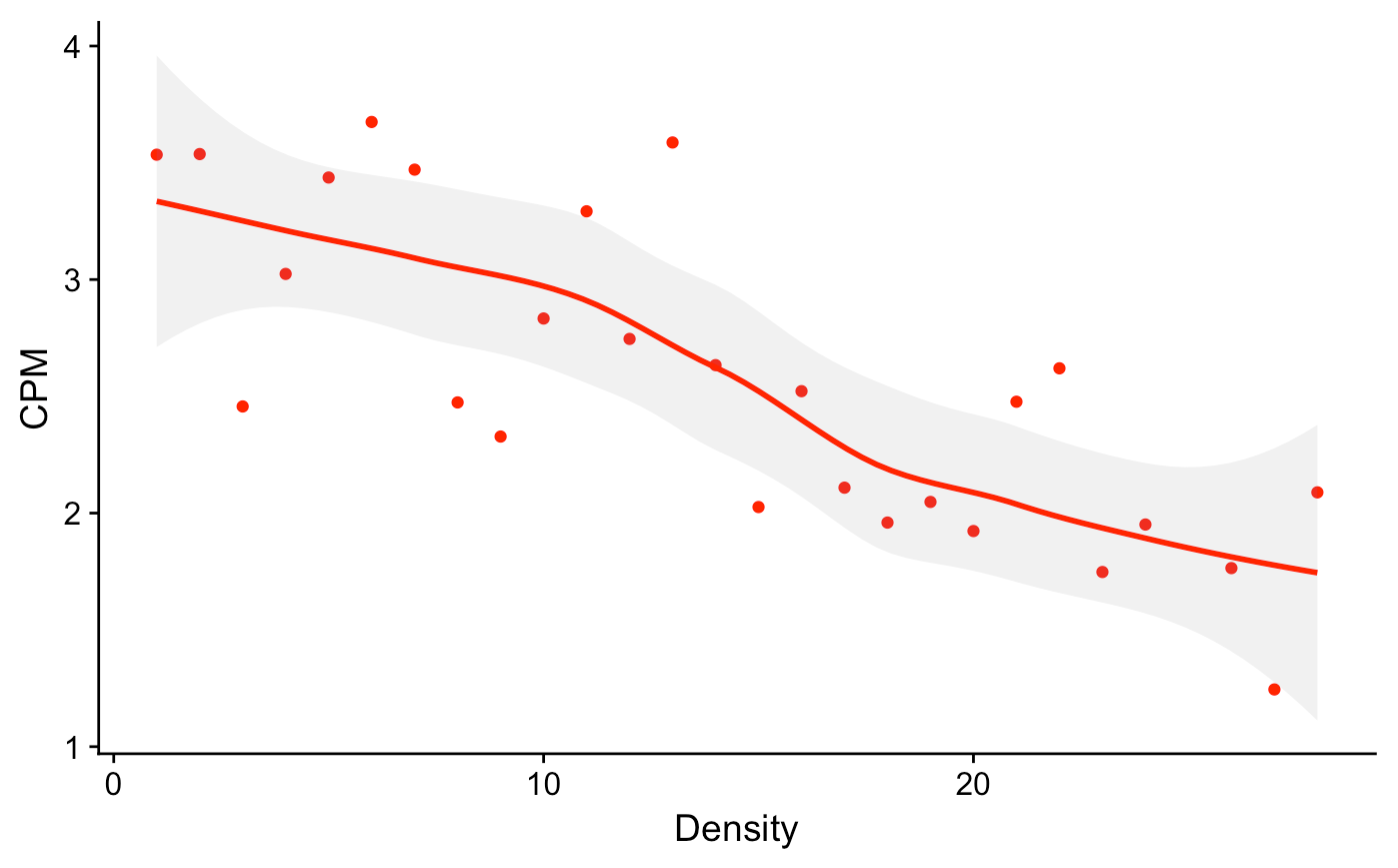
In the above plot I define “density” as the number of ads placed on a give pageview and “CPM” as the average price per 1000 ad impressions across websites at each density. The clear downward trend suggests that adding additional ads to a page has at least a slight negative impact on price. This can be studied more thoroughly by holding sites and ad sizes constant, but it’s hard to do this and maintain a useful sample size without having access to a large site’s internal data.
There are a few more things I might look into with this data. Namely, the sample size is getting large enough where it might be an interesting task to try to forecast future CPMs. It also may be interesting to parse out keywords from the urls that impressions belong to and see if there’s any relationship between the content of a page and its CPM. For example, do non-brand-safe keywords (“murder”, curse words, etc.) have a negative impact on CPM? Do commercial keywords (“shopping”, “product”, “amazon”) have a positive impact? Clustering for topics and finding their relationship with ad price might have some interesting results.
I’ll keep collecting data for the time being and might revisit this later. If you’ve made it this far, thanks for reading and let me know what you think!
New project for studying the used and vintage guitar markets
This post explores four algorithms for solving the multi-armed bandit problem (Epsilon Greedy, EXP3, Bayesian UCB, and UCB1), with implementations in Python ...
Multi-armed bandit algorithms are seeing renewed excitement, but evaluating their performance using a historic dataset is challenging. Here’s how I go about ...
An analysis of auction dynamics in client-side header bidding
Using machine learning to predict strategic infield positioning using statcast data and contextual feature engineering.
A quick tutorial on fetching MLB win-loss data with pybaseball and cleaning and visuzlizing it with the tidyverse (dplyr and ggplot).
Tanking becomes a hot topic each season once it becomes apparent which of the NBA’s worst teams will be missing the playoffs. In this post I address the valu...
I’ve been borderline obsessed with the eephus pitch for some time now. Every time I see a player pull this pitch out of their arsenal I become equal parts ex...
For the past three months I have had the exciting opportunity to intern as a data scientist at Major League Baseball Advanced Media, the technology arm of ML...
Throughout my baseball-facing work at MLB Advanced Media, I came to realize that there was no reliable Python tool available for sabermetric research and adv...
A collection of some of my favorite books. Business, popular economics, stats and machine learning, and some literature.
Each cup of coffee I have consumed in the past 5 months has been logged on a spreadsheet. Here’s what I’ve learned by data sciencing my coffee consumption.
Literature is a tricky area for data science. Think of your five favorite books. What do they have in common? Some may share an author or genre, but besides ...
Probabilistic modeling on NFL field goal data. Applying logistic regression, random forests, and neural networks in R to measure contributing factors of fiel...