AxeDB: Guitar Pricing Intelligence
New project for studying the used and vintage guitar markets
January 12, 2017
For the past 5 months, every cup of coffee I have consumed has been recorded as a row in a spreadsheet. Now hear me out; it was a slow day at work in my summer internship, I had been noticing some common patterns in my coffee-drinking habits, and I was beginning to wonder what exactly could be gained from understanding my consumption patterns as a caffeine addict. Am I a creature of habit? Do I change my coffee preferences throughout the day? Does coffee affect my mood? This all sounded testable, but only if I had data. So I got to work.
For the initial experiment design, I decided to track the time of each coffee I drank, the type of coffee that it was (hot coffee, iced coffee, hot espresso, or cold espresso), and what my mood was before and after the cup on an arbitrary 10-point scale. I also decided to add my wakeup time, my start-time at work that day, and how many hours of sleep I had gotten the night before. Once these features were in place, I anchored the spreadsheet to the bookmarks bar on my browser and added a row each time I drank a cup of coffee.
I did not expect that I would have the discipline to log each cup for as long as I have, yet several months and more than 300 cups later, I now have quite a bit of data on my hands. My tools of analysis in this project come from the Python scientific stack (NumPy, SciPy, Pandas, Matplotlib), with the code being available in my personal-project Github repository as an iPython notebook. Here’s what I’ve learned.
The data is broken down into four categories of coffee. 48.8% of my consumption came from plain hot coffees, 36.9% from iced coffee and cold brew, 12.7% from hot espresso beverages, and only 1.4% from cold espresso beverages.
Aggregating this data by week, the distribution of my coffee consumption by category can be visualized in the box plot below. The red lines are the median values for weekly consumption, the boxes display interquartile range (25th through 75th percentile), and the top and bottom whiskers display the minimum and maximum values for each category’s weekly consumption. As will be made clear throughout this analysis, I am really not a fan of iced espresso drinks.
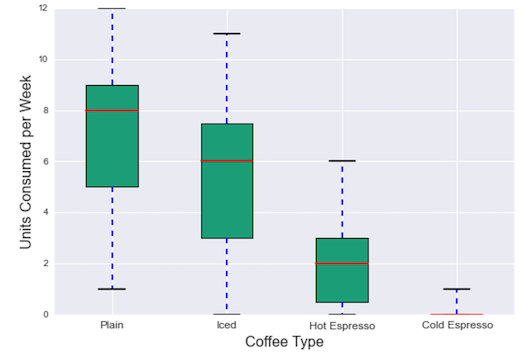
Measuring this in terms of units of caffeine (i.e. one cup of coffee equals one espresso shot), I drank 402 units of caffeine in total: 165 from hot coffee, 125 from iced coffee, 43 from hot espresso, and 5 from iced espresso. Over the 156 days tested, this was 2.57 units per day on average.
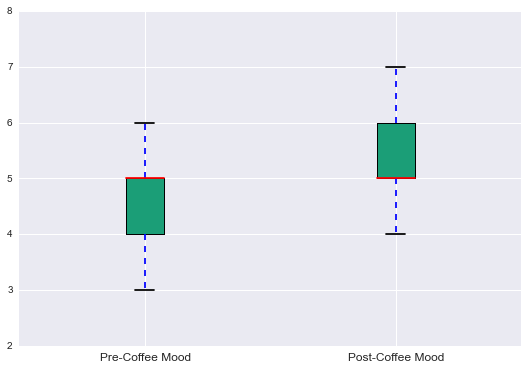
The next question I wanted to answer was whether coffee affectes my mood. To do this, I ran a t-test on the before and after-coffee moods in this data. A t-test is a type of hypothesis test which, in this case, was used to test whether the difference between the pre and post-coffee moods were statistically different from zero (i.e. whether there was a significant change) The resulting t-statistic was large enough to say with a high degree of confidence (over 99.99%) that the “bump” in mood observed after drinking coffee did not happen by chance. To show this visually, you can see a clear difference in the two columns in the box plots below.
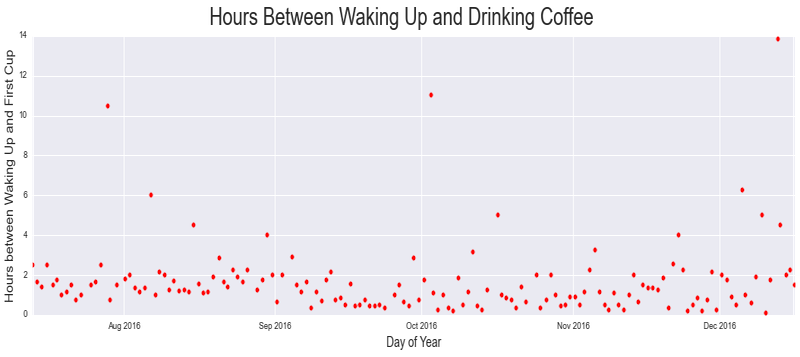
The next thing that piqued my interest was how long I take between waking up and drinking my morning coffee. As a caffeine addict, my assumption was that this timeframe would be relatively small. The data supports this intuition, with my median time-to-first-coffee being 1 hour and 40 minutes while working during the summer, and 1 hour flat while in school. The drop in this timeframe between work and school can be seen in the time series below (see the drop during September 2016). This reduction in time-to-first-coffee upon beginning school is likely more a consequence of having a coffee machine in my dorm during the semester than it is reflective of a change in my morning coffee desires.
Another useful statistical tool for finding insights in data is Pearson Correlation, a measure of the extent to which two variables move together in a linear fashion. The correlations between each pair of features in my data are displayed in the correlation matrix below. A red square means that the two features have a well-defined positive relationship with one-another, a blue one means that the features tend to move in opposite directions, and a colorless square means that there is no linear relationship between those features.
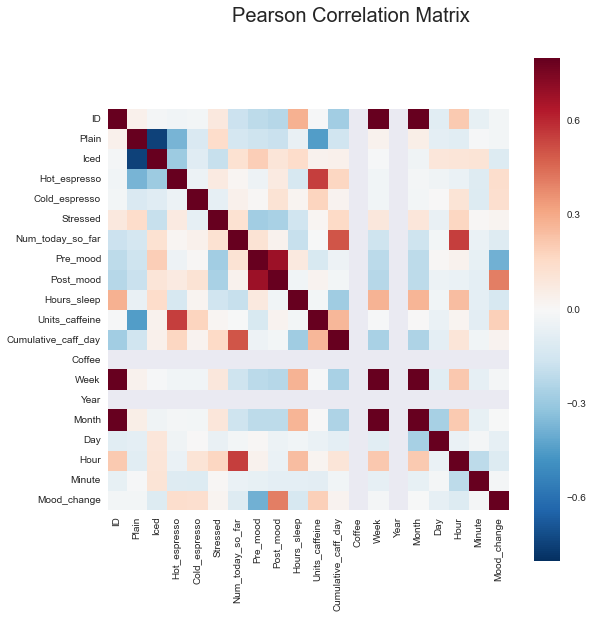
This can be a daunting figure to view and interpret, but a few things stand out. First, it shows that I tend to be in a better mood when I drink iced coffee than when I drink plain coffee. This could either be because iced coffee makes me happy, or because it’s typically availably during the daytime when I’m more awake and less worried about the next day’s responsibilities and deadlines. This would also help to explain why the correlation between happiness and plain coffee is negative, since my late-night study sessions are typically fueled by hot coffee from the dining hall. A few other things that can be seen in this figure are that I got more sleep as the year went on, I drink less coffee when I had more sleep the night before, and I drink more coffee when I’m feeling stressed about something.
Last, I want to see how my consumption changed over time, looking at variations in consumption habits both by hour-of-day and time-of-year.
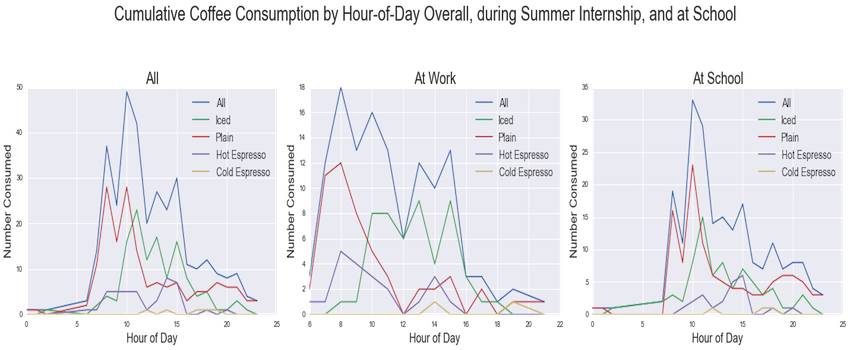
These next three charts look at aggregate coffee consumption by category and hour of day during three different periods: the entire duration of this experiment, during my internship, and during the fall semester of school. Keep in mind that these are different-length time durations, so the coffee counts are not apples-to-apples comparisons between the graphs.
One thing I notice in these is that I tend to begin my days with plain hot coffee, and then move toward iced coffee as the day moves forward. There is also a “lunchtime drop” in the “at work” data, where I essentially cease to pour hot coffee after 12pm.
Comparing the school and work data, a few interesting differences emerge. First, the school data shows two morning peaks, where the work data only shows one. This is because of the split Monday/Wednesday/Friday vs. Tuesday/Thursday nature of the academic schedule causing me to have two distinct morning routines during school, while my routine was more or less uniform while working over the summer. Second, looking to the x-axis, one can see that I drink far more nighttime coffees as a student than I do as an employee. My guess is that this is because coffee is far more available on a college campus than it is in the real world. In college I have dining halls and coffee bars all around me, whereas in Mountain View I would have had to walk a few blocks to find a Starbucks once I’d left the office.
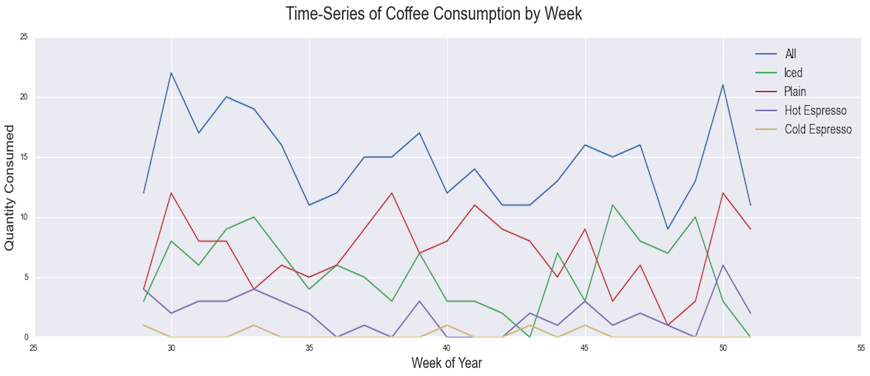
Now that we have seen the micro-patterns of my hourly consumption, let’s see if anything interesting has happened on a macro-scale. This next figure aggregates consumption by coffee-category and by week over the duration of this experiment. My consumption is relatively consistent overall, with no major outliers. On the individual-category level, there is a noticeable uptick in iced coffee around week 43; this is when I purchased my cold brew maker. There is also a noticeable resurgence of plain hot coffee toward the end of this figure, in week 50; this is when I installed a Keurig in the lab where I did my studying during finals week.
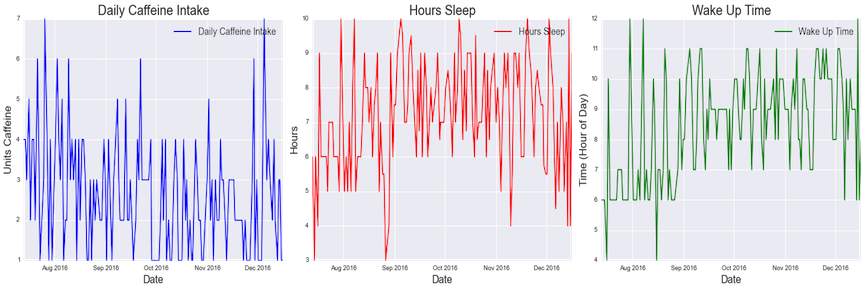
The data is useful for examining things outside the realm of coffee as well. While the obvious relationships to examine are those between coffee and time, stress levels, mood, etc., I was also able to view my sleep patterns as a convenient side-effect of the data that was collected. The center and right-most plots below show that I wake up earlier for work than I do for school, that I generally sleep more in school than I do while working, and that my finals week sleeping patterns are more-or-less equivalent to my sleeping habits while working (see the beginning and end of the Hours Sleep plot).
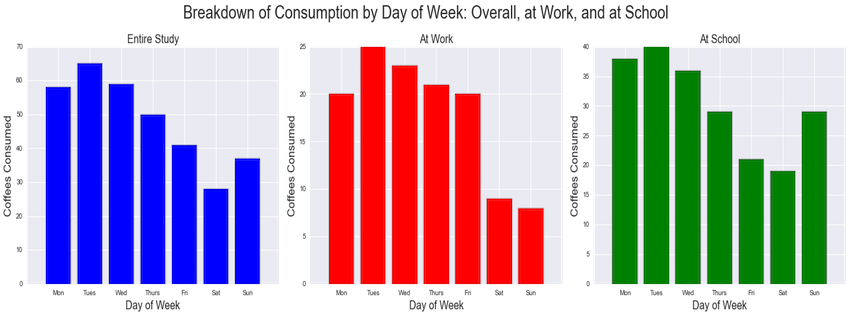
Last, viewing caffeine intake by day-of-week provides a useful insight into my overall working patterns, with caffeine being a loose proxy for workload. At work my caffeine levels were nearly uniform Monday through Friday, with very little consumed on weekends. In school, I consume heavily Monday through Thursday, slow my consumption Friday and Saturday, and resume standard consumption levels on Sunday.
This accurately reflects the nature of an academic workload, with Sundays functioning similar to weekdays and Fridays functioning as a part of the weekend. Additionally, there is more weekend consumption overall during school than during work, reflecting the fact that while you can leave your job for the weekend, you can never fully escape exams and problem sets.
A common pattern throughout this data is that my coffee consumption is driven largely by availability. I drink more nighttime coffee in college than while working because it’s there and it’s available. I drink plain coffee in the mornings because the barista lines are too long for anything containing espresso. I get my morning coffee faster in school than I do at work because I have a Keurig in my dorm and did not have one at home during the summer. The takeaway from this is that I essentially drink however much coffee is put in front of me. I will consume a significant amount of caffeine given the opportunity, but will not go very far out of my way to find coffee otherwise.
Among the primary questions I began this experiment with was whether I am a creature of habit. The answer coming from this data is a resounding “yes.” My consumption varies very little day-to-day, exhibiting clear “peak” times during which I almost always have a cup. My coffee habits are a close reflection of my working patterns.
This data also lends support to the hypothesis of a caffeine dependency. Both the stable consumption patterns over time and the statistically significant mood change associated with caffeine intake make this claim difficult to refute. This is also supported by the fact that I care enough about caffeine to have tracked its consumption on a spreadsheet for the past 150+ days. Because that’s a completely normal thing to do.
Now there are of course several issues with this data, and it would not hold up to most scientific standards. The mood index is completely arbitrary, for example, and I typically have little ability to remember my pre-coffee mood, or to gauge how it may have changed. Additionally, many of the coffee-times I have entered were logged as much as 30 minutes after the cup was consumed, meaning that several of the recorded timestamps are approximations. For a just-for-fun experiment, however, I am quite happy with how it has turned out, and I plan to continue logging entries in this spreadsheet until I catch myself forgetting and the data quality decreases.
To see the code from this analysis, check out my github repo here and give me a star if you feel so inclined. Thank you for reading!
New project for studying the used and vintage guitar markets
This post explores four algorithms for solving the multi-armed bandit problem (Epsilon Greedy, EXP3, Bayesian UCB, and UCB1), with implementations in Python ...
Multi-armed bandit algorithms are seeing renewed excitement, but evaluating their performance using a historic dataset is challenging. Here’s how I go about ...
An analysis of auction dynamics in client-side header bidding
Using machine learning to predict strategic infield positioning using statcast data and contextual feature engineering.
A quick tutorial on fetching MLB win-loss data with pybaseball and cleaning and visuzlizing it with the tidyverse (dplyr and ggplot).
Tanking becomes a hot topic each season once it becomes apparent which of the NBA’s worst teams will be missing the playoffs. In this post I address the valu...
I’ve been borderline obsessed with the eephus pitch for some time now. Every time I see a player pull this pitch out of their arsenal I become equal parts ex...
For the past three months I have had the exciting opportunity to intern as a data scientist at Major League Baseball Advanced Media, the technology arm of ML...
Throughout my baseball-facing work at MLB Advanced Media, I came to realize that there was no reliable Python tool available for sabermetric research and adv...
A collection of some of my favorite books. Business, popular economics, stats and machine learning, and some literature.
Each cup of coffee I have consumed in the past 5 months has been logged on a spreadsheet. Here’s what I’ve learned by data sciencing my coffee consumption.
Literature is a tricky area for data science. Think of your five favorite books. What do they have in common? Some may share an author or genre, but besides ...
Probabilistic modeling on NFL field goal data. Applying logistic regression, random forests, and neural networks in R to measure contributing factors of fiel...