AxeDB: Guitar Pricing Intelligence
New project for studying the used and vintage guitar markets
January 10, 2016
The new NFL extra point rule requires a kicker to attempt his extra point from 32 yards out. This attempt is 13 yards longer than under the previous rule, originally a 19-yard attempt. Though this longer attempt is still a chip shot to any professional kicker, many NFL analysts were surprised to see the rise in missed extra points at the onset of the 2015 NFL season. Should this really have been a surprise, though? Using NFL field goal data going back to the 2000 season, I aim to shed light on the highly predictable patterns that field goal attempts follow, building probabilistic models to show the likelihoods of field goal success in any plausible scenario, as well as how such models can affect the game from a scout or coach’s perspective.
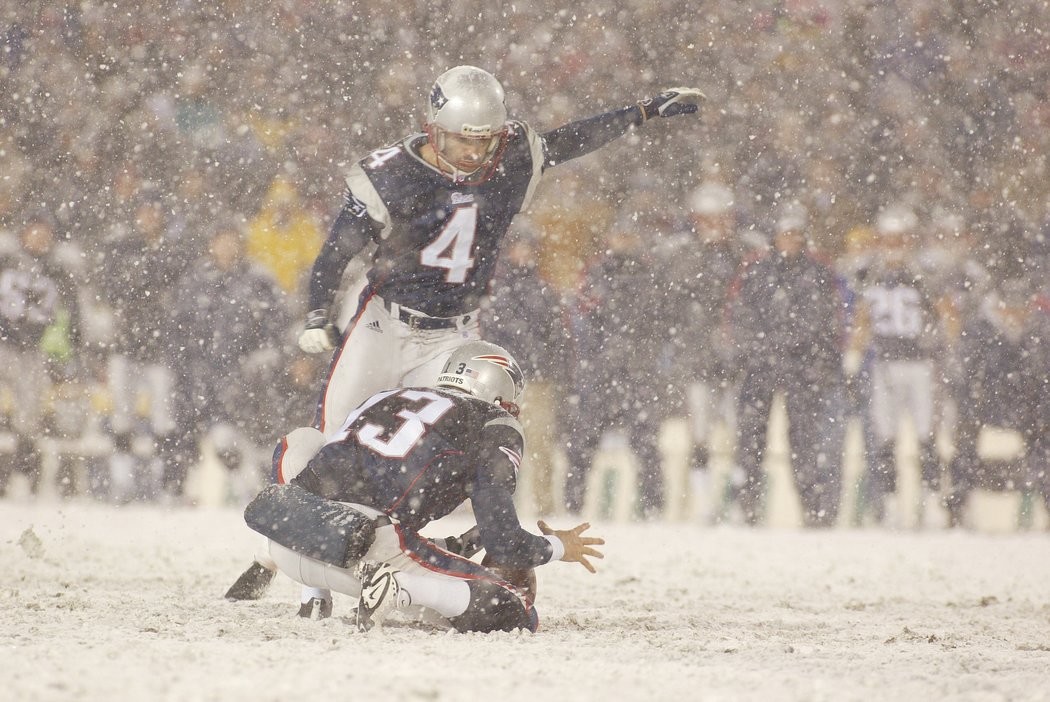
The importance of this type of modeling is clear when one considers that not all kicks are created equal. The 2002 “Snow Bowl” game between the New England Patriots and Oakland Raiders is perhaps the best example of this. In this divisional playoff game, the Patriots turned to kicker Adam Vinatieri to save the game with a tying 45-yard field goal. Even the most casual of fans could tell that Vinatieri’s odds of success were poor for this supremely difficult kick; a combination of 19-degree weather, gusts of wind, snow blusters, and situational pressure made this about as difficult an attempt one could imagine from this distance. Using predictive modeling, this kick had an estimated 54% likelihood of going through the uprights. Those are very low odds for a field goal attempt.
Comparatively, a similar game played in pleasant conditions would have had vastly improved odds. Had this game taken place in sunny Oakland that afternoon, on the Raiders’ home field, this same 45-yard attempt would have had a 71% chance of success. The impact of distance, situational pressure and climate factors on field goal difficulty is illustrated below, where the likelihoods of field goal success in the Snow Bowl game are compared to those in its hypothetical Oakland-based counterpart.
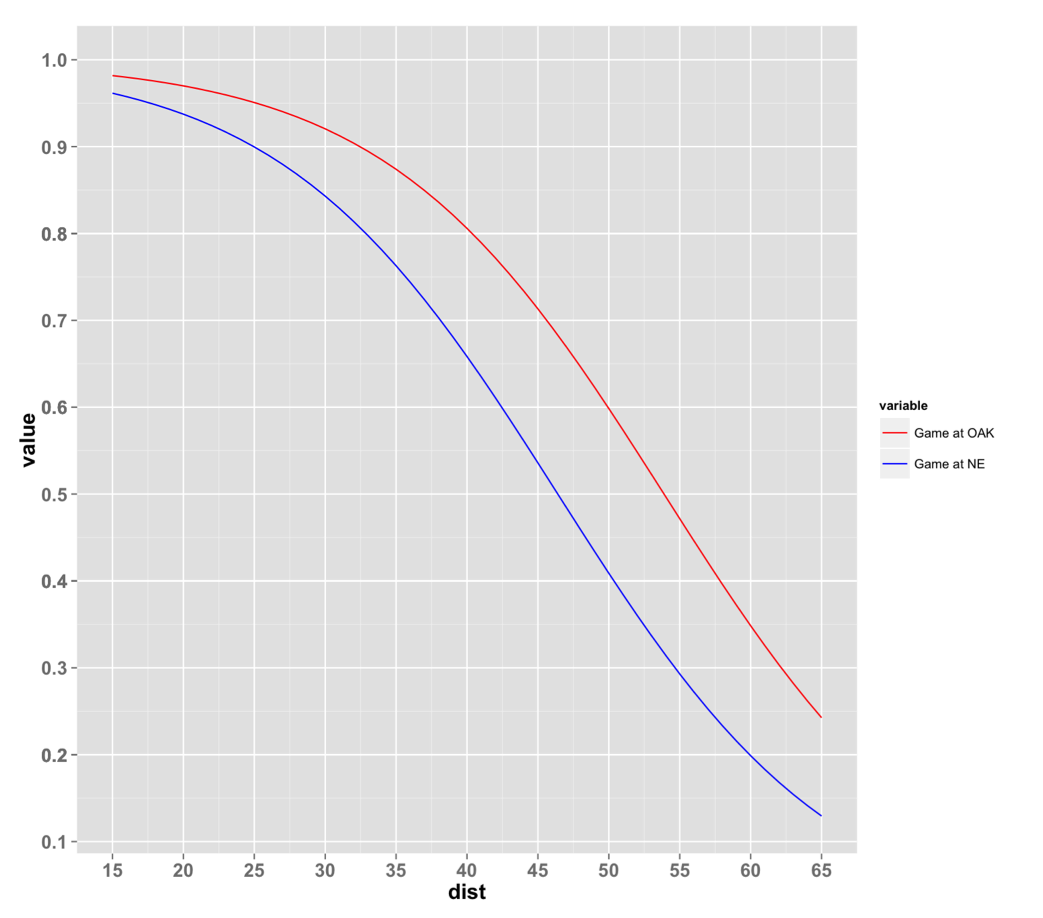
Probabilities of Field Goal Success in New England vs. in Oakland on Jan. 19, 2002
Though Vinatieri’s attempt was good, in what has since gone down in NFL history as one of the greatest clutch kicks of all time, the above figure shows just how much this attempt was affected by the climate and situational pressure that surrounded it. Not all kicks are created equal, and the Patriots organization and fan base had ample reason to breathe a sigh of relief when Vinatieri’s kick went through the uprights.
These comparative probability functions were modeled using the combined results of a logistic regression model, inspired by this paper written for the MIT Sloan Sports Analytics Conference, and a neural network. Using this predictive model, one is able to understand the estimated probability of success for any field goal as a function of its distance, temperature, wind speed, field surface, altitude, precipitation level, and whether the kicker was iced (situational pressure). To get an idea of just how much field goal difficulty differs based on distance and other factors, each point on the following graph is a field goal attempted in the recent past and its estimated probability of success:
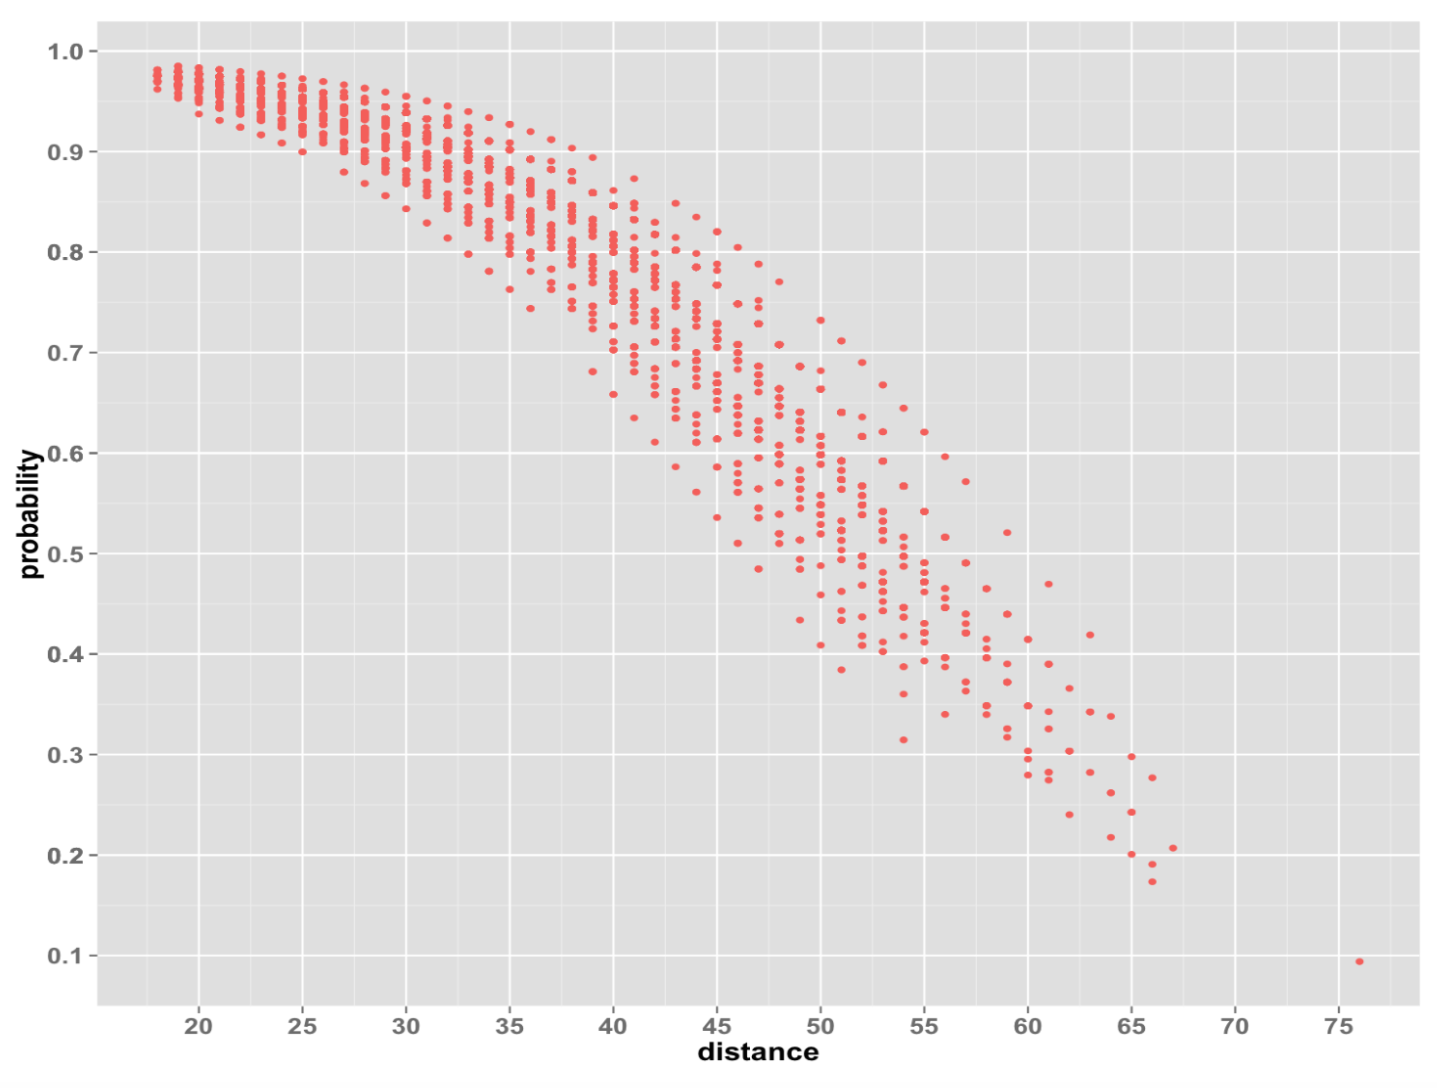
Results of Testing the Model on Unseen Data
As an aside, this chart also presents an answer to the earlier-posed question about extra point likelihoods. It turns out that the drop in extra point percentage this season (from 99.6 to roughly 95%) should not, indeed, have been a surprise. It should always be expected that increasing the distance of an attempt will make it less likely to succeed.
The value of this model goes far beyond improving estimations of field goal odds alone. Using these probability estimates, we can also develop a new metric that better assesses kicker ability. The most common kicker evaluation statistic in use today is field goal percentage. This measure falls victim to the same issue as the game-winning kick discussed earlier: that not all field goals are created equal. A player’s team quality, home-field climate, and many other factors contribute to the reality that some kickers are simply provided with more difficult opportunities than others. For this reason, field goal percentage does not tell the entire story of a kicker’s abilities.
A far better measurement can be produced using probability estimates. Torin Clark and his team call this statistic added points. Added points takes the difference between a kick’s projected probability of success and its observed result (1 for a make, 0 for a miss), and multiplies this by 3, the number of points that the field goal is worth. The result is a measurement that rewards players greater amounts for making difficult field goals than easy ones, and that is similarly more forgiving of difficult misses than easy ones.
points added = (field goal outcome - probability of success) x 3
Calculating this value for all field goals in a kicker’s career, one can then determine who has contributed the most points per attempt above the expected value. These are the kickers who create the most value for their teams.
Best Kickers by Points-Added
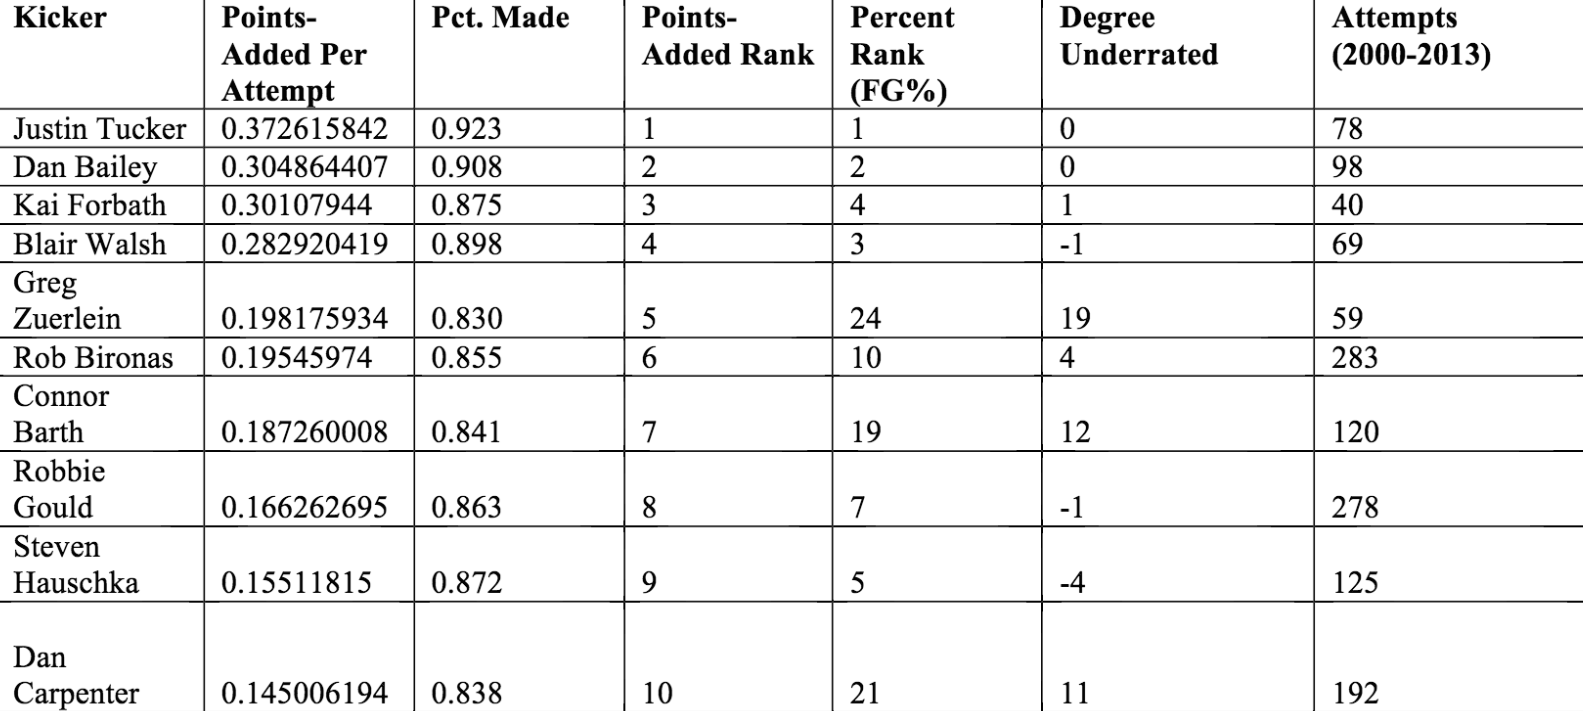
Additional to determining who the best kickers are, one can also determine who is most underrated by taking the difference between rankings in terms of field goal percentage and points-added. These are the kickers whose field goal percentages most under-sell their true values.
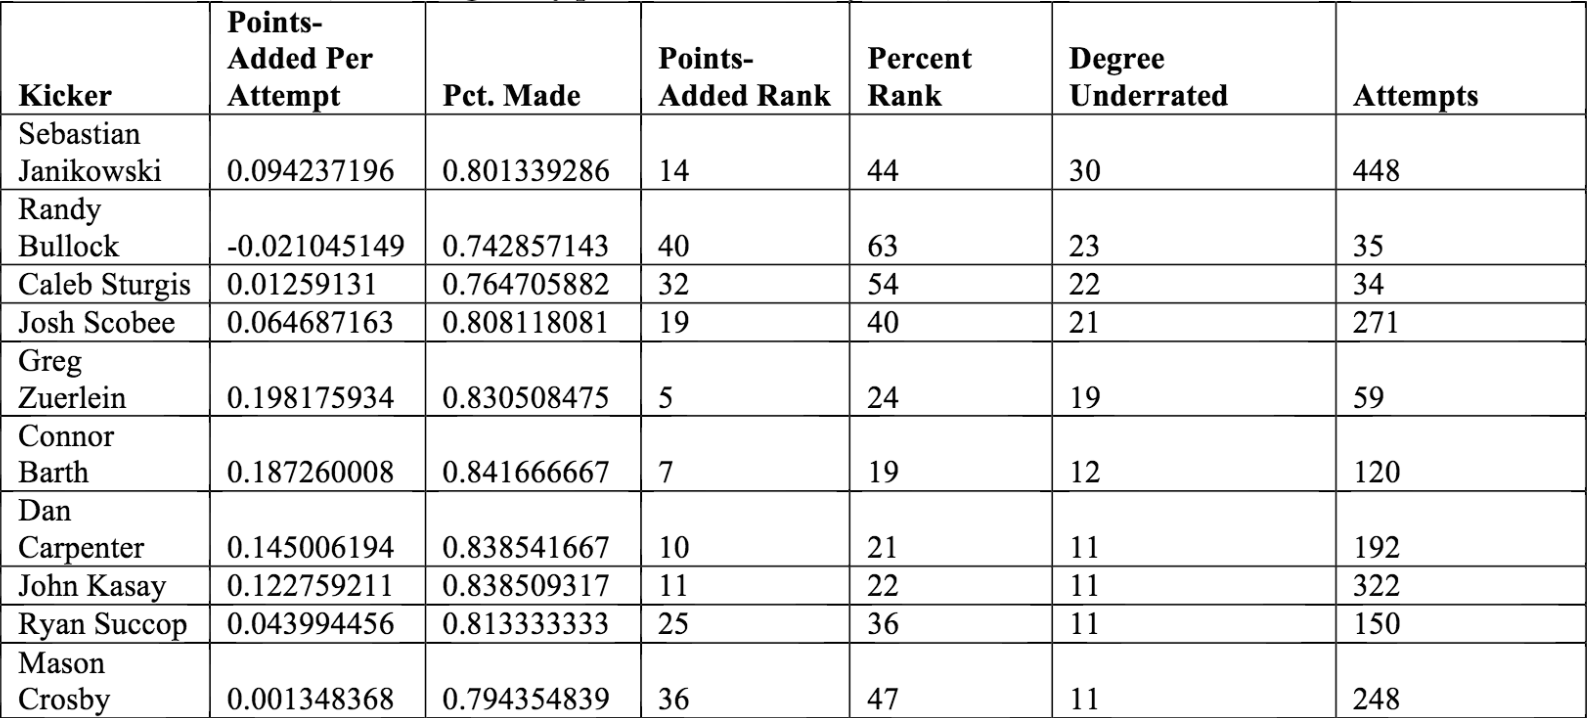
Most Underrated Kickers by Points-Added Metric
Understanding field goal conversion likelihoods is crucial in all ends of the game. Understanding not only that distance, climate factors, and situational pressure have tangible impacts on field goal success, but also to what extent they do, could make all the difference in weighing the risk and potential reward of a crucial coaching decision. This understanding can lead to improved fourth down decision making.
Understanding the points-added methodology, and that field goal percentage is a biased metric, could lead to better front office decision making as well. Signing and drafting “bargain” kickers in this way, underrated due to any range of factors, has a Moneyball-esque appeal to it, and is a definite arbitrage opportunity for managers in today’s game.
To conclude, this study teaches two main things:
First, that field goals follow predictable patterns, allowing their probabilities of success to be modeled to a useful degree. This can and should be taken into consideration by coaching staffs during their evaluations of game time decisions.
Second, that good kickers really do matter. Finding a great one like Rob Bironas or Sebastian Janikowski can make all the difference in a 16 game season where playoff outcomes are not determined until the very last week, or in a playoff game where a single point-added above average replacement is all that stands between being a runner-up and a super bowl champion.
While baseball has been thoroughly transformed by sabermetrics and the Moneyball revolution, football, having smaller sample sizes with its 16-game seasons, still has a way to go in its acceptance of statistics as the governing dynamics of certain aspects of play. Field goal kicking, however, being the isolated component of play that it is, has the potential to be one of the first great leaps in the quantification of the ways that coaches, scouts and fans view the game. Through the acceptance of methods and models such as those discussed in this article, NFL organizations can make great strides in improving their abilities to make data-informed decisions that maximize the potential values of their rosters.
For a deeper dive into the modeling and data behind this article, and also the complete tables on kicker rankings, please view my formal writeup at github.com/jldbc/field-goal-models. Thank you for reading!
New project for studying the used and vintage guitar markets
This post explores four algorithms for solving the multi-armed bandit problem (Epsilon Greedy, EXP3, Bayesian UCB, and UCB1), with implementations in Python ...
Multi-armed bandit algorithms are seeing renewed excitement, but evaluating their performance using a historic dataset is challenging. Here’s how I go about ...
An analysis of auction dynamics in client-side header bidding
Using machine learning to predict strategic infield positioning using statcast data and contextual feature engineering.
A quick tutorial on fetching MLB win-loss data with pybaseball and cleaning and visuzlizing it with the tidyverse (dplyr and ggplot).
Tanking becomes a hot topic each season once it becomes apparent which of the NBA’s worst teams will be missing the playoffs. In this post I address the valu...
I’ve been borderline obsessed with the eephus pitch for some time now. Every time I see a player pull this pitch out of their arsenal I become equal parts ex...
For the past three months I have had the exciting opportunity to intern as a data scientist at Major League Baseball Advanced Media, the technology arm of ML...
Throughout my baseball-facing work at MLB Advanced Media, I came to realize that there was no reliable Python tool available for sabermetric research and adv...
A collection of some of my favorite books. Business, popular economics, stats and machine learning, and some literature.
Each cup of coffee I have consumed in the past 5 months has been logged on a spreadsheet. Here’s what I’ve learned by data sciencing my coffee consumption.
Literature is a tricky area for data science. Think of your five favorite books. What do they have in common? Some may share an author or genre, but besides ...
Probabilistic modeling on NFL field goal data. Applying logistic regression, random forests, and neural networks in R to measure contributing factors of fiel...