AxeDB: Guitar Pricing Intelligence
New project for studying the used and vintage guitar markets
July 27, 2017
Baseball and statistics go together like peanut butter and jelly; it’s almost hard to imagine following one without involving the other. In recent years, the data that make this game enjoyable for so many have only gotten better. With the introduction of the Statcast system for measuring sci-fi-sounding statistics such as the spin speed of a thrown ball and its launch angle off a player’s bat, I believe we are at the beginning of an exciting new era for baseball statistics.
Unfortunately for Python-loving statisticians like myself, there has historically been no tool for bringing this data into one’s work without a painful process of manual curation. For this reason, I’m releasing pybaseball: an open source package for 21st century baseball data analysis in Python.
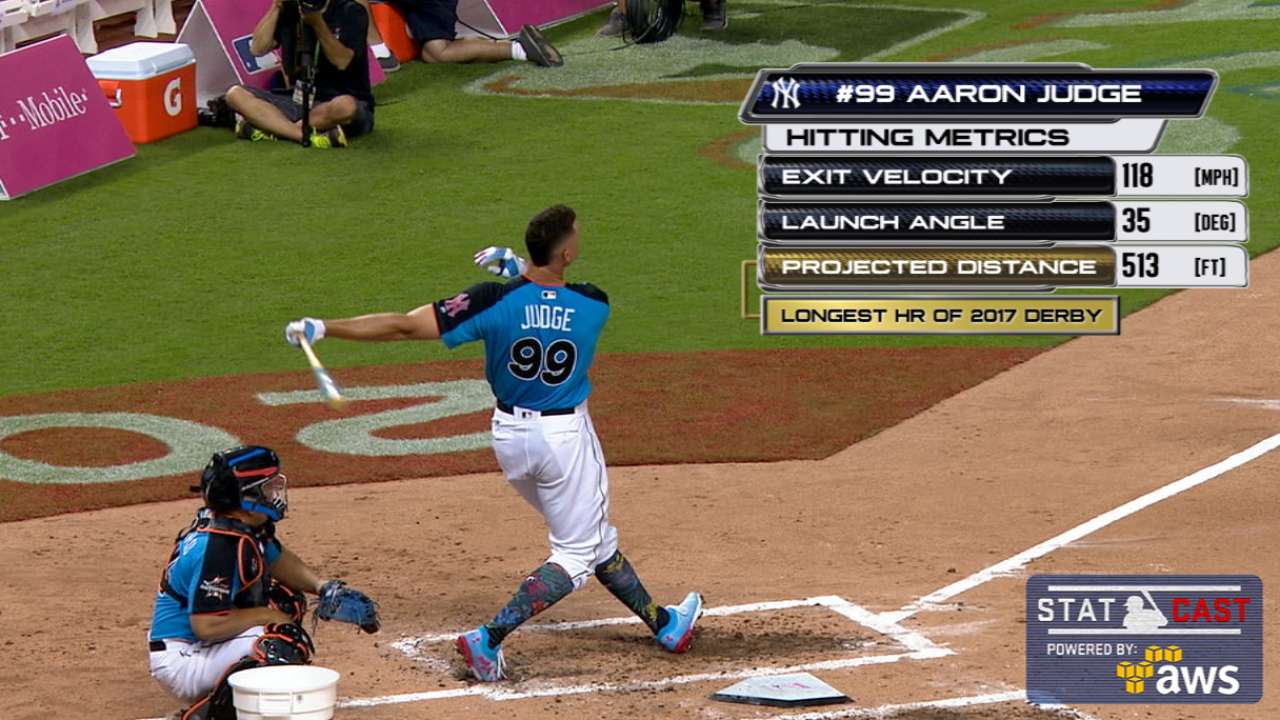
How does Aaron Judge hit baseballs into the stratosphere? Pybaseball and Statcast can help you find out (image: mlb.com)
Pybaseball takes the pain out of collecting and cleaning baseball data from the internet. In short, I scraped Baseball Savant, FanGraphs, and Baseball Reference so you don’t have to. Currently, this means that you can retrieve pitch, season, and game-level data on individual players and teams, historic schedule and record data, and division standings with simple, Pythonic one-liners. The stats that this library provides range from the classics (BA, RBI, HR, W, L, K, IP), to the slightly more sophisticated (OBP, SLG, WHIP, WAR), to what would have sounded like science fiction a few short years ago (exit velocity, spin speed, pitch x, y, and z coordinates). The goal of this library is to provide the data necessary to answer any baseball research question.
The statcast function returns statcast pitch-level data.
>>> from pybaseball import statcast
>>> data = statcast(start_dt='2017-06-15', end_dt='2017-06-28')
>>> data.head(2)
   index pitch_type  game_date  release_speed  release_pos_x  release_pos_z
0    314         CU 2017-06-27           79.7        -1.3441         5.4075
1    332         FF 2017-06-27           98.1        -1.3547         5.4196

  player_name    batter   pitcher     events     ...      release_pos_y
0   Matt Bush  608070.0  456713.0  field_out     ...            54.8585
1   Matt Bush  429665.0  456713.0  field_out     ...            54.3470

   estimated_ba_using_speedangle  estimated_woba_using_speedangle  woba_value
0                          0.100                            0.137         0.0
1                          0.269                            0.258         0.0

   woba_denom babip_value iso_value launch_speed_angle at_bat_number pitch_number
0         1.0         0.0       0.0                3.0          64.0          1.0
1         1.0         0.0       0.0                3.0          63.0          3.0
[2 rows x 79 columns]
Similarly, if you want player-level stats aggregated by season, you can pull 299 different features per player per season from FanGraphs using the pitching_stats and batting_stats functions.
>>> from pybaseball import pitching_stats
>>> data = pitching_stats(2012, 2016)
>>> data.head()
     Season             Name     Team   Age     W    L   ERA  WAR     G    GS
336  2015.0  Clayton Kershaw  Dodgers  27.0  16.0  7.0  2.13  8.6  33.0  33.0
236  2014.0  Clayton Kershaw  Dodgers  26.0  21.0  3.0  1.77  7.6  27.0  27.0
472  2014.0     Corey Kluber  Indians  28.0  18.0  9.0  2.44  7.4  34.0  34.0
235  2015.0     Jake Arrieta     Cubs  29.0  22.0  6.0  1.77  7.3  33.0  33.0
256  2013.0  Clayton Kershaw  Dodgers  25.0  16.0  9.0  1.83  7.1  33.0  33.0

       ...      wSL/C (pi)  wXX/C (pi)  O-Swing% (pi)  Z-Swing% (pi)
336    ...            1.76       22.85          0.364          0.665
236    ...            2.62         NaN          0.371          0.670
472    ...            3.92         NaN          0.336          0.598
235    ...            2.42         NaN          0.329          0.618
256    ...            0.74         NaN          0.339          0.635

     Swing% (pi)  O-Contact% (pi)  Z-Contact% (pi)  Contact% (pi)  Zone% (pi)
336        0.511            0.478            0.811          0.689       0.487
236        0.525            0.536            0.831          0.730       0.515
472        0.468            0.485            0.886          0.744       0.505
235        0.468            0.595            0.856          0.762       0.483
256        0.484            0.563            0.873          0.763       0.492

     Pace (pi)
336       23.4
236       23.7
472       24.6
235       23.3
256       23.4

[5 rows x 299 columns]
But wait, there’s more! Say you’re interested in comparing the performances of historic teams. That, too, is easy with pybaseball. With this package, one can dissect the 1927 “Murderers Row” Yankees season with a single line of Python.
>>> from pybaseball import schedule_and_record
>>> data = schedule_and_record(1927, 'NYY')
>>> data.head()
                Date   Tm Home_Away  Opp W/L     R   RA   Inn  W-L  Rank  \
1    Tuesday, Apr 12  NYY      Home  PHA   W   8.0  3.0   9.0  1-0   1.0
2  Wednesday, Apr 13  NYY      Home  PHA   W  10.0  4.0   9.0  2-0   1.0
3   Thursday, Apr 14  NYY      Home  PHA   T   9.0  9.0  10.0  2-0   1.0
4     Friday, Apr 15  NYY      Home  PHA   W   6.0  3.0   9.0  3-0   1.0
5   Saturday, Apr 16  NYY      Home  BOS   W   5.0  2.0   9.0  4-0   1.0

       GB      Win     Loss  Save  Time D/N  Attendance  Streak
1    Tied     Hoyt    Grove  None  2:05   D     72000.0       1
2  up 0.5  Ruether     Gray  None  2:15   D      8000.0       2
3    Tied     None     None  None  2:50   D      9000.0       2
4    Tied  Pennock    Ehmke  None  2:27   D     16000.0       3
5  up 1.0  Shocker  Ruffing  None  2:05   D     25000.0       4
These examples are just the tip of the iceberg, but hopefully this gives a taste of the power and versatility of pybaseball.
Pybaseball is pip installable. Simply run pip install pybaseball and it’s on your machine.
If any of this piqued your interest, full documentation and complete examples are available on the Github repo here. If you like what you’ve seen so far, please give it a star. If you really like what you’ve seen so far, drop me a suggestion or submit a code improvement. Last, if you end up using pybaseball for any type of project or analysis, I would love to hear about it. Send me a note or reach out on Twitter!
New project for studying the used and vintage guitar markets
This post explores four algorithms for solving the multi-armed bandit problem (Epsilon Greedy, EXP3, Bayesian UCB, and UCB1), with implementations in Python ...
Multi-armed bandit algorithms are seeing renewed excitement, but evaluating their performance using a historic dataset is challenging. Here’s how I go about ...
An analysis of auction dynamics in client-side header bidding
Using machine learning to predict strategic infield positioning using statcast data and contextual feature engineering.
A quick tutorial on fetching MLB win-loss data with pybaseball and cleaning and visuzlizing it with the tidyverse (dplyr and ggplot).
Tanking becomes a hot topic each season once it becomes apparent which of the NBA’s worst teams will be missing the playoffs. In this post I address the valu...
I’ve been borderline obsessed with the eephus pitch for some time now. Every time I see a player pull this pitch out of their arsenal I become equal parts ex...
For the past three months I have had the exciting opportunity to intern as a data scientist at Major League Baseball Advanced Media, the technology arm of ML...
Throughout my baseball-facing work at MLB Advanced Media, I came to realize that there was no reliable Python tool available for sabermetric research and adv...
A collection of some of my favorite books. Business, popular economics, stats and machine learning, and some literature.
Each cup of coffee I have consumed in the past 5 months has been logged on a spreadsheet. Here’s what I’ve learned by data sciencing my coffee consumption.
Literature is a tricky area for data science. Think of your five favorite books. What do they have in common? Some may share an author or genre, but besides ...
Probabilistic modeling on NFL field goal data. Applying logistic regression, random forests, and neural networks in R to measure contributing factors of fiel...